3 min read
Gain continuous cloud cost visibility with customizable business-centric views
 Varsha Mallya
:
Aug 18, 2021 11:33:00 AM
84% of enterprises and 69% of SMBs report that managing their cloud spend is their topmost priority. Cost management is more effective when you have a granular view of costs by applications/department, and the reasons for spikes or overspend. Tools that enable you with business centric views can often double the impact of your decisions. In this blog, Varsha Mallya, Technical Product Manager at MontyCloud, explains how with dynamic, business centric visibility you can now identify unallocated costs, usage and resources with non-compliant tags, as well as take action that saves cloud costs.
-Sabrinath S. Rao
‘Gartner estimates a 70% overspend on cloud resources by organizations who do not have a defined plan for cloud cost management.’, writes Bowen Wang, AWS Billing and Cost Management. As IT teams race to keep pace with the business demand to digitize, wasted spend is inevitable, without proper visibility and cost governance guardrails. With a growing cloud footprint, cloud operators are finding it extremely difficult to keep track of resources and the cost of their dynamic cloud footprint. An efficient tagging strategy is only the first step towards visibility. It takes a lot more to get a dynamic view into spending patterns and to identify continuous cost optimizations.
The top two challenges that IT teams face when stepping into cost management are
1. Lack of cost visibility in the application/business context.
It is easy to mandate broad spend cuts. It is harder to track down which application or department is overshooting the budget.
2. Inconsistency in resource management and tagging
Resources are often unused when users move between projects or abandoned when they change jobs. They are often not tagged appropriately which makes it impossible to track down the owner. Such resources often account for the majority of the cost spikes.
For example, one of our customers – a large online pharmacy saved $300,000/year by identifying and terminating abandoned/unused resources.
AWS offers solutions such as Cost allocation tags as well as Cost and Usage Reports that can help provide specific usage metrics and forecast. However, these reports need to be manually configured and it takes additional effort to map the data to provide meaningful insights in the application/business context.
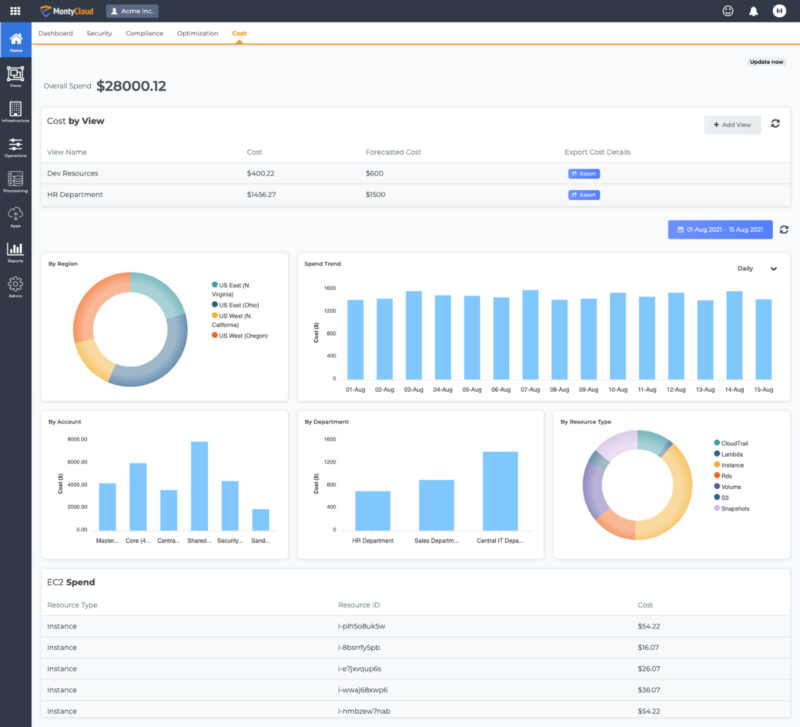
In this blog, I am going to show you how the in-built cost dashboard in DAY2 helps surface important metrics for cloud cost management. It helps you uncover what is causing usage spikes, discover any anomalies and fix them before they show up as surprises in your bills.
Cost Dashboard
You can get instant visibility into your account and access your cloud cost dashboard, with insights organized by department, region, services within a few easy steps. All you have to do is connect your AWS account.

Introducing MontyCloud DAY2 Views
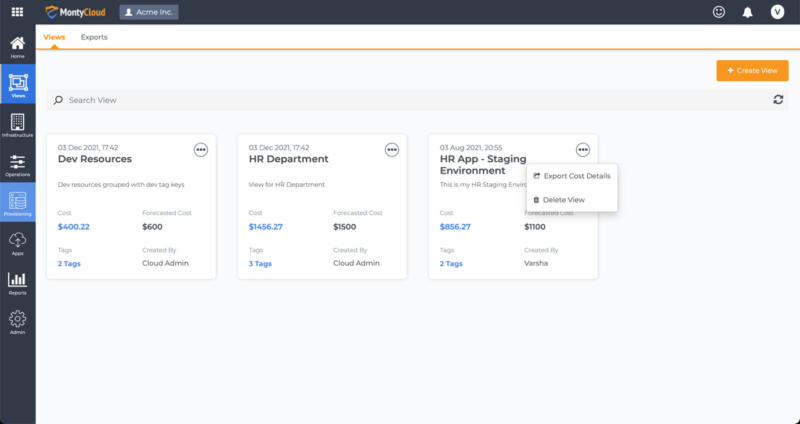
Dynamic business centric visibility can help you identify costs associated with each resource, take appropriate actions and save costs. With DAY2 Views, you can select one or more tags (key-value pairs) and group them into a View that represents your business context. For example, you can select all resources tagged “Environment:Demo” into a single View and review the current spend and forecasted cost. You can get cloud spend and forecasted cost for such Views. You can also download detailed reports with line items for each resource for the time range you choose.
Creating dynamic Views
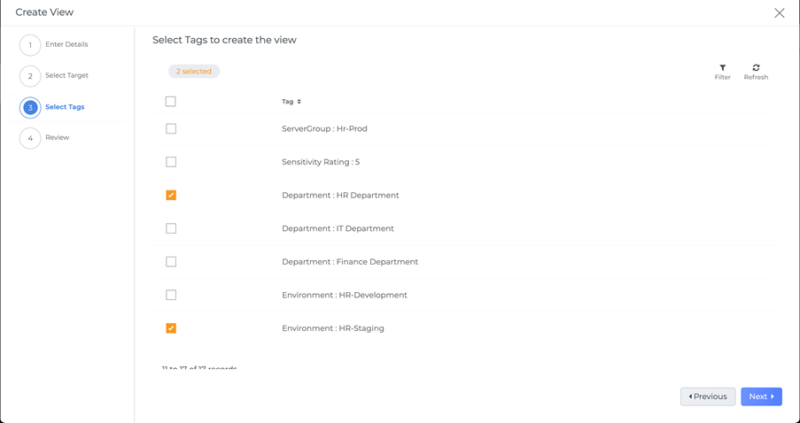
While creating your view, you can select one or more tags that match your view criteria. DAY2 ensures that all the tags available in your connected accounts are available here.

That’s it! A View is now created. This View, for the selected tags, will dynamically stay updated for currently matched resources, and will automatically keep up to include new resources that match the selected tags.

Downloading detailed reports from Views
You can also additionally export a detailed cloud cost report in CSV format for this view. For each view, you have the option to export Cost Details. You can select the date range and type for your export. Types include “Hourly”, “Daily” and “Monthly” based on the type of breakdown you want for the cost report. Once exported, it is available under Exports for download in CSV format.
Now you have complete and continuous visibility into current cloud spend and forecasted spend for the group of resources you created your custom view for.
Taking the next step towards Cost Optimization
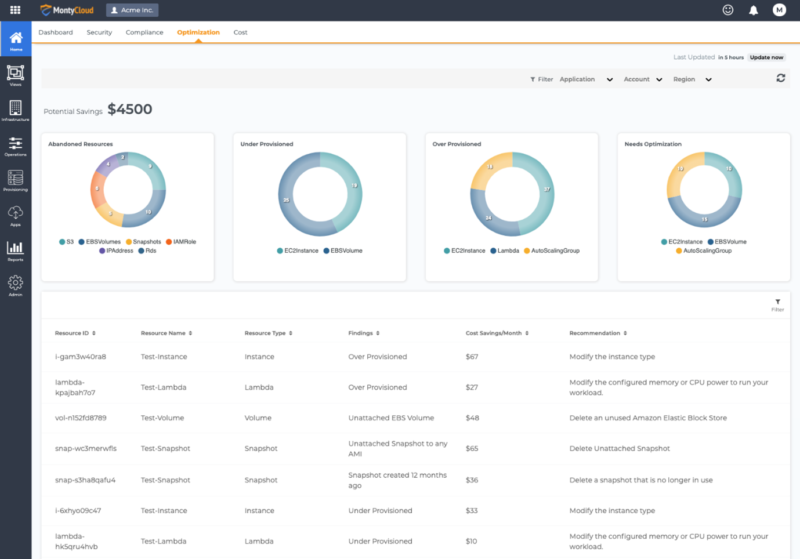
With detailed resource level data in the reports, you can cross check if any of the identified resources could be optimized to save costs. For this, you can use the built-in ‘Cost optimization’ view in MontyCloud DAY2 which provides granular cost saving recommendations such as:
- Abandoned resources
- Overprovisioned resources
- Untagged resources

With this dynamic, business centric visibility you can now identify unallocated cost usage, resources with non-compliant tags and take action that saves Cloud costs. In just a few clicks you can take control of your multi-account, cross-region cloud footprint and start saving costs. IT leaders can now easily ask the important “why” questions such as “Why does department X seem to trend higher in consumption?”, “Why does the staging environment seem to have abandoned resources?”, “Where can we save the most $X across their company?” and more. With this feature you can drive for accountability, specific action, and efficiencies.
Cost views is included for free with MontyCloud’s DAY2 platform.


